LS Instruments is proud to announce the release of the LSI Zimm Plot software. This state-of-the-art software helps the experimentalist in the laborious data treatment process required to extract the physical quantities from the experimental data collected with the 3D LS Spectrometer. Import tools for other experimental data formats are also available, please contact us for more information.
Size, structure, and interaction characterization of colloidal systems are crucial in technological applications, quality control processes, and research. A series of static light scattering experiments performed on different samples at different concentrations of the dispersed material allows for the determination of the molecular weight, the radius of gyration, and the second virial coefficient.

The LSI Zimm Plot Software was developed with the best of the breed programming techniques.
It implements a vectorial data display that allows you to enlarge the Zimm Plot without compromising the graphical quality of the plot. Special attention was given to the user experience and ease of use.
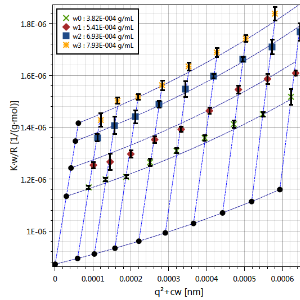
The data fitting algorithm that determines the molecular weight, the radius of gyration, and the second virial coefficient is based on a non-linear, error weighted, least-squares fit on the whole dataset. This greatly improves the robustness of the fit, and it offers the most accurate estimation of the physical quantities.
A typical inconvenience of the Zimm data treatment is the selection of a suitable scaling factor between the scattering vector module, q, and the sample concentration. Improper selection results in poor data display. The LSI Zimm Plot software implements an automated selection that finds the value corresponding to the optimal shaped Zimm plot of the dataset.
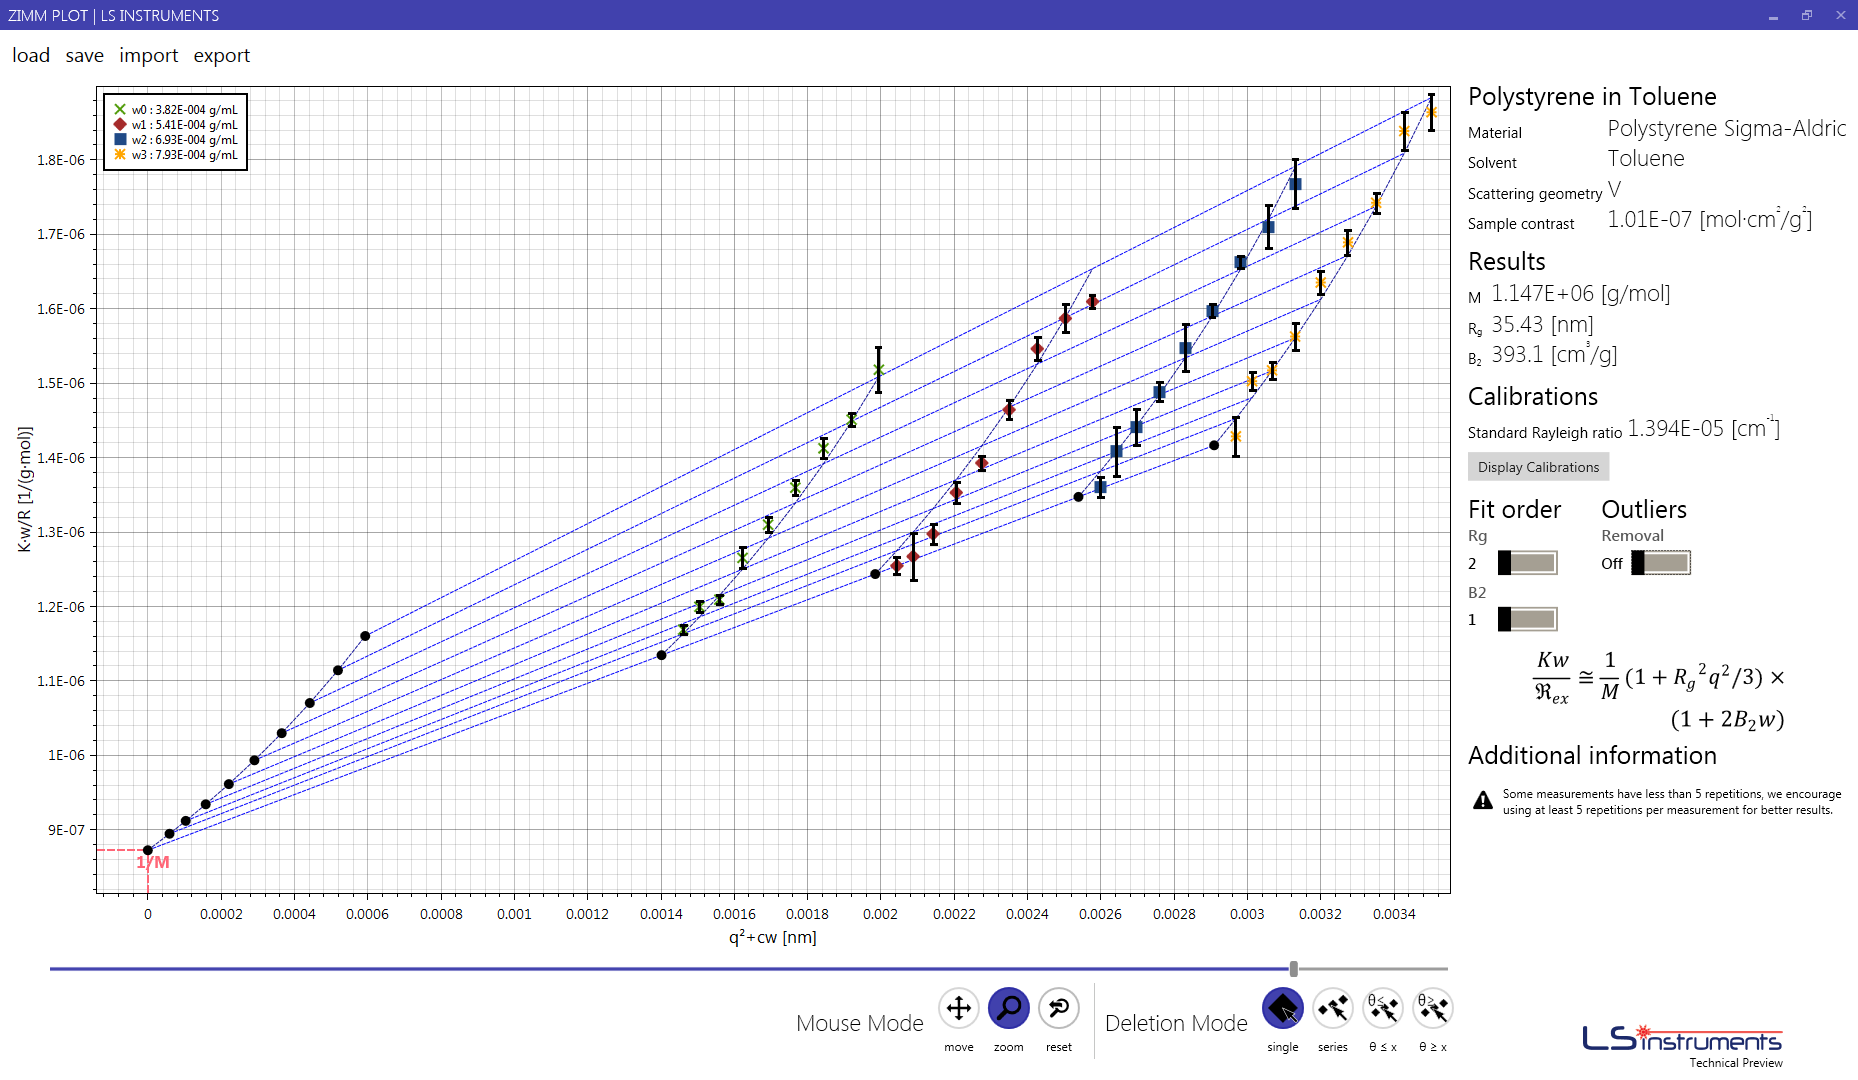
The LSI Zimm Plot software implements the Zimm Plot representation to conveniently and synthetically display the collected experimental data and the corresponding fit.
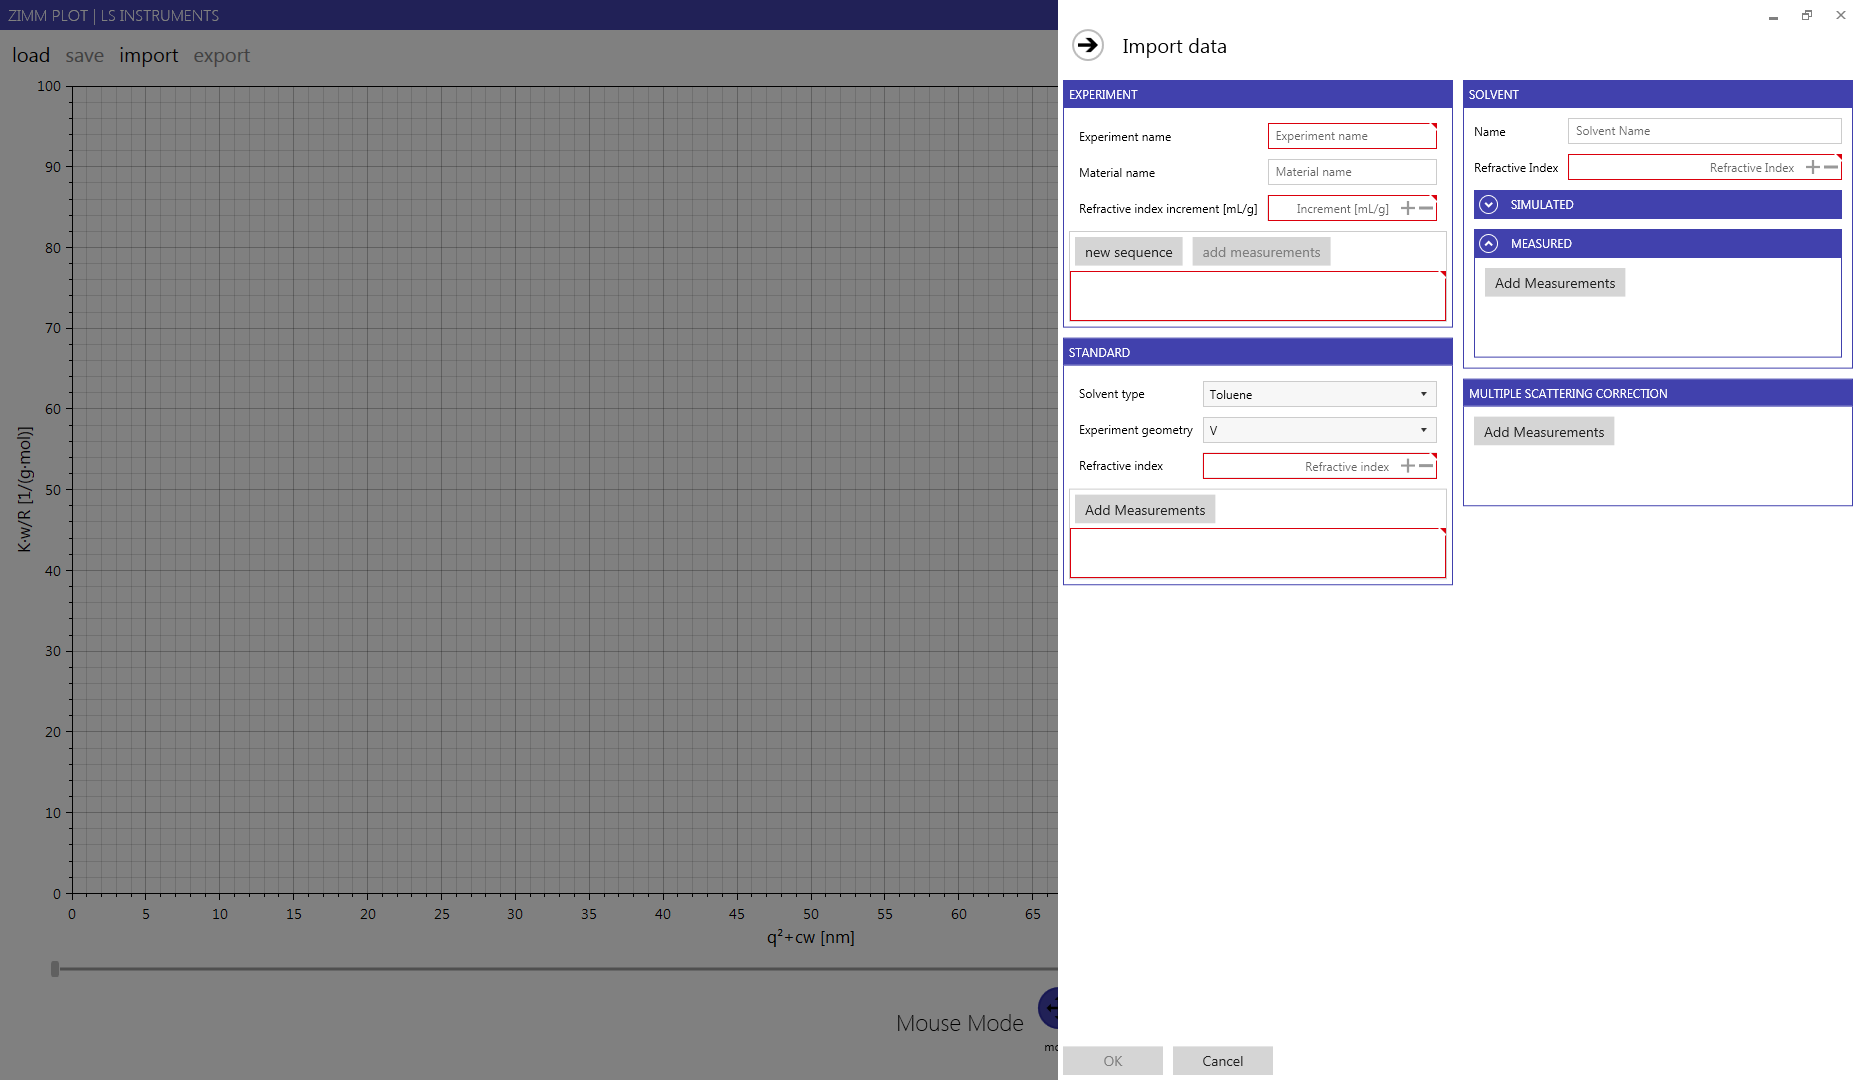
Building the Zimm Plot dataset from the measurement files can be time consuming and unwieldy.
The LSI Zimm Plot software will guide you through this process, by suggesting the input of the required experimental parameters while ensuring the consistency of the imported dataset. Once imported, the data is saved into a single file format which is possible to re-load, ensuring you can return to where you left off in just few mouse clicks.
By adopting robust regression for the estimation of measurement mean and standard deviation the software can, without user intervention, automatically exclude spurious high intensity repetitions originating by impurities in the samples.
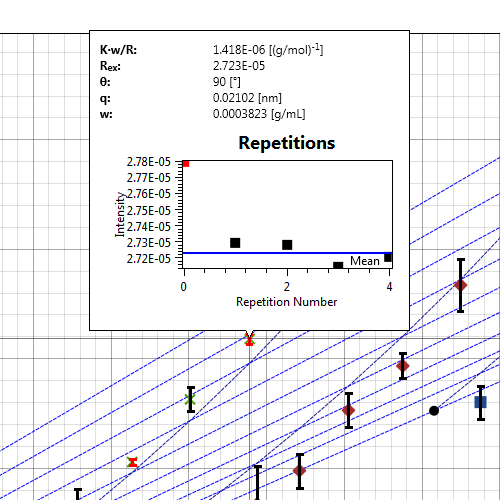
The LSI Zimm Plot software instantaneously recomputes the fit and updates the graph and the displayed results each time you change any settings of the fit and/or excludes data points.
In some cases, preparation of the sample used to measure the solvent contribution to the scattered signal can be challenging. For example, preparing dust-free water samples requires great experimental skills. To simplify the task of the experimentalist, the LSI Zimm Plot software enables you to compute the solvent contribution from the dataset collected for the standard calibration, once the solvent Rayleigh ratio is known. This feature effectively removes the need for solvent measurement.
You can remove a single data point, ranges of data points, and complete concentration series in just a couple of mouse clicks.
Simple export of the data allows you to:
The fit order can easily be changed and the result will be displayed in real time.
You can display the standard calibration and the solvent measurements to assess their quality.
The Rayleigh ratio is automatically calculated at different temperatures and wavelengths for both Benzene and Toluene.